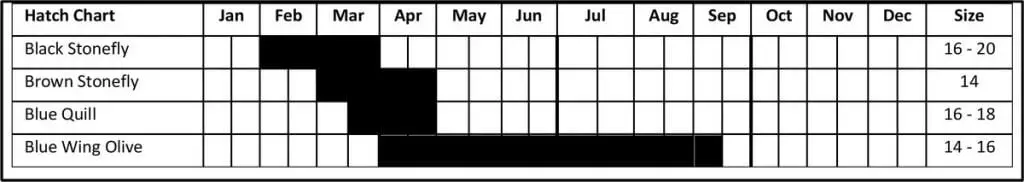
Typically, experts develop hatch charts through years of observation, and different people may see different things based on when they are on the stream; resulting in small differences. Why? Nature always introduces uncertainty. Using the example, there is no guarantee the first black stonefly will emerge on February 1 or disappear from the environment on March 31. Also, the sizes are approximate. A size 16 may be the exact wrong choice in February, but the perfect match in late March. However, it’s a pretty good bet that by the end of February or early in March, black stoneflies should be present on both the stream and in your fly box.
Using the calendar as a start point, anglers need to factor in current conditions. For example, a colder than normal season will delay a hatch while warm weather will accelerate it; sliding the bar on the chart right or left. Altitude matters with hatches impacted by microclimates associated with higher altitudes and sheltered valleys. Given the variability of hatch start/finish, many charts communicate uncertainty by showing a gradient fill at the two ends of the active period. Now get specific for the day of your trip. When during the day does the hatch typically occur? Morning? Evening? Consider the weather. A storm might come up, a blistering heat wave may spike water temperature and even clouds changing the intensity of light or unusually low or high pressure may have a say in what happens on a specific day.
All this suggests a few simple rules.
The best hatch charts are specific to a small area. The hatch chart built for the Savage River in Maryland is going to be more accurate than the Orvis chart covering the entire Eastern seaboard. As an example, the Orvis chart has the spring hatches starting in mid-March, but guidance from the Savage River Outfitter fly shop perched on the riverbank caveats – “Most all of the Eastern hatches are here. Generally, they occur a couple of weeks later on the Savage River tailwater than the hatches on the surrounding freestone streams.”
Check in with a fly shop (ideally in person). Fly shops with guide services have the best information since their staff is on the water every day and their hatch chart will be the most accurate since business depends on it. In most cases, the shop can answer the daily timing question – AM or PM? Point of etiquette… while not required, it is polite to buy a few of the recommended flies from the shop (or something else) as fair trade for the information. Price competition from the internet is crushing – support fly shops!
If fishing a river or stream not covered by a fly shop, search social media (blogs or angler forums are always good) for current information. While you may not receive advice on where to fish, most anglers will share what is working on a particular stream and when during the day to use it.
Trout Unlimited chapters usually have pretty good hatch charts on their websites for their favorite streams (example: TU Gold Rush Chapter in Dahlonega, GA – http://tinyurl.com/zkfvxdz)
Don’t despair if, despite all your research, you reach the stream and … nothing… no surface action. Switch gears. All insects go through a lifecycle that includes the nymph, and they will be around long before a hatch explodes on the surface. Besides, as much as we enjoy fishing dry flies, the reality is 80% of a trout’s diet is nymphs; implying fishing nymphs will usually result in more caught fish.
One quick trick… after concluding everything is spooked on the first pool you fish, wade into the stream if it is safe to do so. Stand in the current and use a small net or DIY seine made from a small piece of mosquito netting stapled to two pencils and capture whatever is floating on top as well as at different levels in the water column. Turn over some rocks and see what floats downstream. Check the netted critters and match color and size as best you can!
Finally, midges work all season, always have a few stimulator patterns to fall back on, and trout may still respond to a pattern for up to two weeks after the associated hatch ends.
As a side note, the Orvis hatch charts contain links to pictures of each fly as a nymph, emerger, adult, and spinner (http://tinyurl.com/zve63vc) and is very helpful to make sure the patterns you think you have are the patterns you need.